Technical Skills in Data Analytics:

By: Tayyaba Afzaal

Digital Communication and Information Management (DCIM):

DCIM refers to a set of processes, tools, and technologies used to efficiently organize, analyze, and manage digital communication and information within an organization. This concept is heavily related to the role of a Data Analyst as their main job is to clean, organize and present data so that it conveys something that will aid in decision making. Similar to how information is organized and delivered through DCIM, I have used the blog format to convey helpful skills for upcoming data analysts to be better prepared and knowledgeable about the position. My site is dedicated to students and employers alike to learn more about my interests and outlook on the tech world.

What do Data Analysts do?

Data analysts use technical tools to parse large quantities of raw information in order to develop meaningful insights. Data analysts are often responsible for removing corrupted data, determining data quality, and preparing reports. These tasks require data analysts to have well-developed skills in the following areas.

Data Visualization

Data Visualization is presenting data findings via graphics or other illustrations. This aims to facilitate a better understanding of data-driven insights, even for those not trained in data analysis. With data visualization, you can identify patterns and understand complex ideas at a glance, which aid in a businesses decision making.

Data visualization allows you to accomplish more than data analysts traditionally have. “Data visualization is going to change the way our analysts work with data. They’re going to be expected to respond to issues more rapidly. And they’ll need to be able to dig for more insights — look at data differently, more imaginatively. Data visualization will promote creative data exploration” (SAS Insights).

Data Cleaning

Uses & Benefits: An important part of buliding a functional machine-learning model is data cleaning, this usually makes up most of the workload for data analysts (Hillier 2023).

  • Staying organized: Businesses collect a lot of information from clients, customers, product users, etc. Cleaning data regularly means keeping it organized.
  • Avoiding mistakes: Dirty data doesn’t just cause problems for data analytics. It also affects daily operations. If a database is in good order, the company will have access to helpful, accurate information. If it’s a mess, mistakes are bound to happen, such as using the wrong name in personalized invitations.
  • Improving productivity: Regularly cleaning and updating data means quickly purging rogue information. This saves teams from wading through old databases or documents to find what they’re looking for.

With an adequately cleaned dataset, even simple algorithms can generate remarkable insights. In contrast, uncleaned data can produce misleading patterns and lead a business toward mistaken conclusions. Data analysts need proper data cleaning skills to avoid such mistakes.

Python

Learning Python is a top priority for would-be analysts. One poll by the Institute of Electrical and Electronics Engineers’s (IEEE) found that Python ranked second in a list of the top ten programming languages used in work settings in 2023.

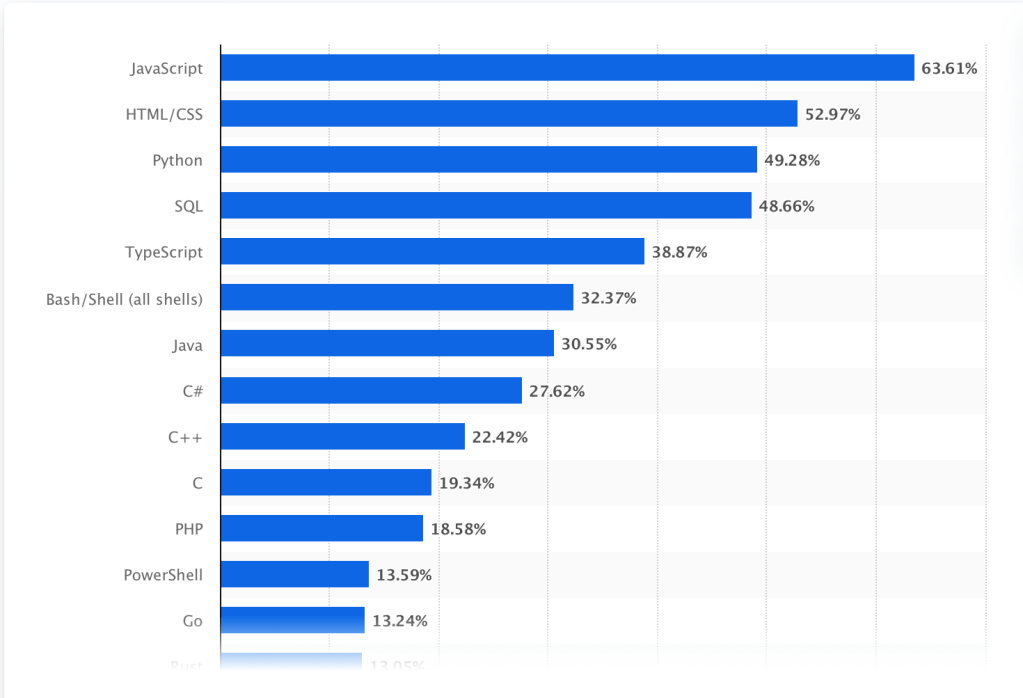
Another Statista report lists it as the third most used language among developers worldwide as of 2023. Studies like these convey how widely used and important Python is to a data analyst. 

Most used language by developers worldwide:

There are many online courses available to attain this skill. Still, there are also many free YouTube videos dedicated to teaching Python, such as the one below from “Programming with Mosh”:

SQL

To break into Data Analytics there are several coding languages you need to be familiar with. This is often a mandatory prerequisite by employers.

SQL was first created in 1970, but it remains invaluable. SQL remains the standard for querying and handling data in relational databases in modern analytics. 

SQL’s versatility in interfacing with various data tools and its widespread integration in tools like Talend, Alteryx, Tableau, Looker, and Google Data Studio makes it an essential language for data professionals. Proficiency in SQL is necessary for managing and manipulating large datasets efficiently, facilitating data analysis and transformation across diverse platforms. It enables users to access, update, delete, and add data and perform powerful sorting, filtering, and aggregation tasks swiftly. SQL’s ability to join data sets is crucial for deriving more profound insights from multiple sources and enhancing the analysis of relationships and patterns (Hauer & Deora 2023).

Moreover, SQL’s automation capabilities, including stored procedures, functions, triggers, and views, empower users to automate data processing tasks, saving time and effort. The automation also accelerates time to insights, contributing to the overall decision-making agility of businesses and creating opportunities for career advancement in roles such as solutions consultants or SQL developers.

Microsoft Excel

“Excel skills” frequently appears as a requirement for jobs listed for data analysis. Excel enables users to create charts, graphs, and pivot tables to visualize data and gain insights into trends and patterns.

Excel offers essential tools for data analysis, including pivot tables and charts that transform complex datasets into structured and visually representative information. Conditional formatting enhances the organization of data, creating visually appealing displays. Excel’s dashboards allow for a concise presentation of crucial information. Fundamental functions such as MATCH, LOOKUP, and RANK form the basis for diverse data analysis capabilities in Excel, enabling tasks like data retrieval, error detection, and complex mathematical operations. Excel is also valuable for regression analysis, elucidating relationships between variables, and predicting future connections, facilitated by the Analysis ToolPak add-in, which provides advanced tools for sophisticated calculations ( WGU 2023).

References:

Cass, S. (2023, August 29). The Top Programming Languages 2023 – IEEE Spectrum. Spectrum.ieee.org. https://spectrum.ieee.org/the-top-programming-languages-2023

Features of Excel to Use in Data Analysis. (n.d.). Western Governors University. https://www.wgu.edu/blog/features-excel-use-data-analysis2308.html

HILLIER, W. (2021, November 12). What Is Data Cleaning and Why Does It Matter? Careerfoundry.com. https://careerfoundry.com/en/blog/data-analytics/what-is-data-cleaning/

Python for Beginners – Learn Python in 1 Hour. (n.d.). http://Www.youtube.com. Retrieved January 10, 2024, from https://youtu.be/kqtD5dpn9C8?si=w6EbiJpnuHvOn1sg

SaS. (2019). Data Visualization: What it is and why it matters. Sas.com. https://www.sas.com/en_us/insights/big-data/data-visualization.html

Statista. (2022). Most Used Languages among Software Developers Globally 2019. Statista. https://www.statista.com/statistics/793628/worldwide-developer-survey-most-used-languages/

Why SQL is a must-have skill for every data analyst | Blog | Fivetran. (n.d.). http://Www.fivetran.com. Retrieved January 10, 2024, from https://www.fivetran.com/blog/why-sql-is-a-must-have-skill-for-every-data-analyst#:~:text=SQL%20presents%20a%20simple%20and

Project Takeaways

After the completion of the Questbridge podcast project, several significant lessons were brought to light, shaping my overall understanding of both the subject matter and the creation process.

Firstly, the experience of creating the Questbridge podcast highlighted the profound impact of technology in amplifying voices and advocating for social causes. The use of SoundCloud and Audacity not only amplified audio production but allowed us to convey the mission of Questbridge in a compelling and accessible way. This hands-on learning feature of audio technologies was very effective in promoting the proper learning of digital tools.

Additionally, the importance of effective storytelling emerged as a central theme throughout the project. Crafting the podcast in an advertisement-style format using a blend of information and emotion conveyed the power of “narrative” in conveying complex ideas and resonating with our target audience. Understanding how to communicate a message in a way that is both informative and emotionally engaging is another valuable skill that I learned in this course and look forward to using in the future.

In conclusion, the Questbridge podcast project and this course have been a transformative learning experience, providing insights into storytelling, and technology. These takeaways will extend beyond this course and will shape my future approach to projects and collaborations. I am grateful for the opportunity to apply theoretical concepts in a practical setting allowing myself to build proper foundational knowledge of the subject.

Questbridge Scholarship Podcast

This is an educational podcast targeted toward fellow and upcoming college students who may be overwhelmed by higher education costs. Questbridge is a nonprofit scholarship program that can help students in need and urges students to visit the site and learn more about the organization.

Here is a link to the podcast:

Questbridge Podcast:

The podcast “Bridge Beyond” explores the QuestBridge Match Scholarship, focusing on its potential to open doors for students in the realm of education and financial aid. The intent is to provide a detailed examination of the scholarship, highlighting both its advantages and drawbacks. The pros include the comprehensive coverage of a full four-year scholarship, valued at over $200,000, lifting the financial burden for students and their families. Some cons include its restrictions on eligibility and other factors such as participation in a work-study program.

Below is a list of my group members who also made informative podcasts on the Questbridge Scholarship. Be sure to check out their sites to learn more about the opportunities Questbridge offers.

Questbridge PSA

Questbridge PSA Soundcloud

This is a public service announcement, targeted toward fellow and upcoming college students who may be overwhelmed by higher education costs. Questbridge is a nonprofit scholarship program that can help students in need and this PSA urges students to visit the site and learn more about the organization.

” In order for recording companies to bolster the claims of realism and presence and
truth-to-the-original that pervade the history of sound reproduction, playback had
to be faithful (utilizing a frequency range wide enough to approximate the original
sounds) – but it also had to be loud (capturing a dynamic range comparable to
that of the original sounds). If the volume was feeble, the overall reproduction was
less real, less believable, and lower in fidelity (Devine 2013).

My SoundCloud clip was in accordance with these guidelines, as I made sure to fade in and fade out my background track which helped focus on my announcement. As well as lowering the overall volume of the background music to ensure that my message was clear and coherent.

Interests Page Tutorial

Creating a dedicated page on your website that showcases relevant projects and the practical applications of your skills can be a highly effective way to gain the attention and interest of both fellow students and potential employers. Furthermore, including a tutorial video on this page can enhance its effectiveness even more.

For one, it can showcase your dedication. A page dedicated to relevant projects and skills demonstrates your expertise and competence in your field. This not only impresses fellow students but also catches the eye of employers who are constantly on the lookout for talented individuals. As well as fellow students, who can also be inspired by your projects, finding ideas and solutions for their own work. This not only builds your reputation but also fosters a culture of knowledge-sharing within your academic or professional community.

Visual guides are helpful because they provide clear instructions and guides that are easy to follow along, especially if it is your first-ever website. Tutorial videos can provide step-by-step guidance on how you completed a project or executed a specific task. This helps viewers understand the practical aspects of your work, making it easier for them to replicate your methods.

Just as the DIY information was spread faster and more efficiently in Christine Wolfs’ journal, “DIY videos on Youtube: Identity and Possibility in the age of AI”. The journal states, “Many participants talked about the prominent role YouTube played in their DIY information practices, often noting how the videos have changed information routines, impacting the perceived relevance of other media sources, such as books”(Wolf 2016). This refers to the impact YouTube had on the growth and trend of DIY hacks and tips. Over YouTube’s short lifespan, there have been thousands of tutorial videos and the audience has proven to connect to them more over regular text instructions.

Lastly, videos often hold viewers’ attention for longer periods, increasing the time they spend on your website. Videos can be accessed and understood by a global audience, making it an excellent tool for showcasing your abilities to potential employers and collaborators worldwide. Taking these benefits into account, I decided on the topic and direction of my tutorial video.

My Header

The header image on my portfolio website consists of a word collage of data-related terms and data processing icons that convey several key messages to my viewers.

Firstly, the word collage of data-related terms like “data” and “storage” immediately communicates the central theme of the website, which is my passion for data analysis and related fields. It sets the tone for the entire website, signaling to visitors that they are entering a space dedicated for me to showcase my work regarding data analytics.

Secondly, the inclusion of data processing icons reinforces the technical aspect of my expertise. It suggests that I have practical knowledge and skills in handling data and using relevant tools and technologies. The icons also convey what the process of data analytics consists of, specifically why people are necessary in order to compute the data.

For the source images, I used royalty-free and licensed images from reputable sources like stock photo websites. I had the right to reuse them for my website, through a Creative Commons license, and I gave appropriate credit where required.

In terms of the production process, I followed the principles outlined in Manovich’s article on multi-layered images. I used Pixlr to layer various elements – the word collage, data processing icons, and background – to create a visually rich and dynamic header image. This allowed me to control the placement and opacity of each element, creating a finished product that visually represents my skills and interests.

Davison’s single-layer bitmap image had one key difference and that was that it was single-layered. Multi-layered images provide greater creative freedom and the ability to adjust individual elements, making them more suitable for conveying specific messages. In contrast, single-layer bitmap images are simpler but do not offer the same depth and creativity.

Welcome

About Me

Hello! I am Tayyaba Afzaal, a current senior at Rutgers University-New Brunswick. I am majoring in Information Technology and Informatics, and minoring in Digital Communication Information and Media. My goal and passion is to work as a data analyst at a social network once I graduate, and potentially help companies expand. Be sure to view all pages of my site and learn more about me and my interests. Reach out on the contacts page if you have any questions or want to collaborate!